

Hey! Guys,
when it comes to the tools that network engineers find handy, I bet everyone has quite a few options in mind. Tools need to be updated in line with our requirements, but our thinking must not stand still. Studying a new tool can not only boost work efficiency but might also expand the boundaries of our knowledge.
For more information, please scan the WhatsApp QR code below to contact customer service.

01 Cacti
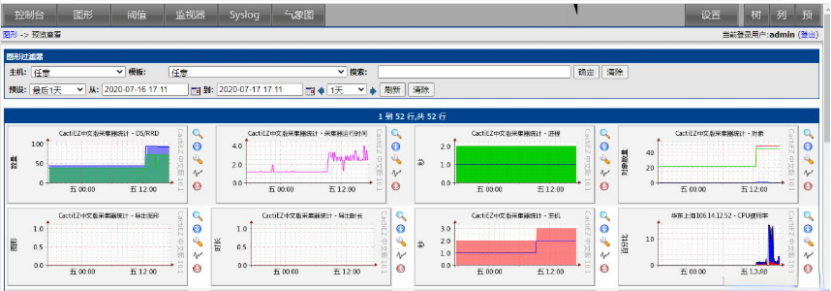
Cacti is a network traffic monitoring and analysis tool developed based on PHP, MySQL, SNMP, and RRDTool. It can generate intuitive graphical reports.
Its data and user management functions are excellent. It can accurately set the tree structure, hosts, and charts that each user can view. It can also integrate with LDAP for user authentication and supports custom templates. With complete and practical functions, it also has a user - friendly interface design.
In addition to basic SNMP traffic and system information monitoring, Cacti can also meet more diversified monitoring requirements through external scripts, template addition, and other means.
02 Icinga
Icinga was originally a fork of Nagios and later evolved into Icinga 2. Currently, both versions are still under continuous development and updates. Icinga 1.x is compatible with Nagios plugins and configurations, making migration quite convenient.
Icinga 2 is more streamlined and flexible, supporting distributed monitoring and a multithreaded framework, which are advantages that neither Nagios nor Icinga 1 possess.
Similar to Nagios, Icinga can monitor all devices that communicate via IP, achievable through SNMP, custom plugins, and add-ons.
It has several available web interfaces, and the most significant difference from Nagios lies in its configuration method - it can be directly operated through the web interface without having to modify configuration files, which is particularly user - friendly for those who dislike the command line.
Additionally, Icinga can integrate graphic and monitoring tools such as PNPP4Nagios, inGraph, and Graphite, providing solid performance visualization reports with more comprehensive reporting features compared to similar tools.
03 Zabbix
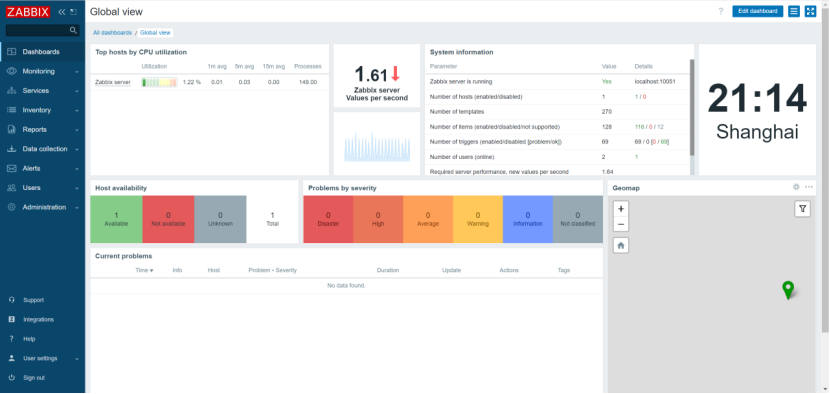
Zabbix is an open-source monitoring solution based on a web interface. It can achieve comprehensive monitoring of distributed systems and networks and is an enterprise-level tool.
It can track various network parameters in real-time to ensure the stable operation of the server system. Once a problem occurs, it can also help administrators quickly locate and solve it through a flexible notification mechanism.
The Zabbix server supports collecting status data of remote servers and networks through multiple methods such as SNMP, Zabbix agent, ping, and port monitoring, and can run on multiple platforms such as Linux, Solaris, HP-UX, AIX, FreeBSD, OpenBSD, and OSX.
The Zabbix agent needs to be installed on the target server to be monitored. It is mainly responsible for collecting hardware information and status data of the operating system such as memory and CPU.
The Zabbix agent also has strong compatibility and can run on systems such as Linux, Solaris, HP-UX, AIX, FreeBSD, OpenBSD, OSX, Tru64/OSF1, Windows NT4.0, Windows 2000/2003/XP/Vista.
The Zabbix server can either monitor the service status of remote servers alone or cooperate with the Zabbix agent - it can either actively poll the agent to obtain monitoring data or passively receive data sent by the agent.
04 Ganglia
Ganglia is an open-source cluster monitoring project initiated by the University of California, Berkeley, specifically designed for monitoring thousands of nodes.
Its core components include gmond, gmetad, and a web frontend.
It is mainly used to monitor system performance, such as CPU utilization, memory usage, disk utilization, I/O load, network traffic, etc. Through the generated curve charts, the running status of each node can be visually seen, which is very helpful for the rational allocation of system resources and the improvement of overall performance.
A daemon process called gmond runs on each computer, responsible for collecting and sending performance data.
The host that receives these data can display the data and also transmit the refined information to the upper structure. This hierarchical design gives Ganglia good scalability.
gmond has a minimal impact on the system load, so running it on each computer in the cluster will not affect user usage. However, it should be noted that frequently collecting a large amount of data may affect node performance.
The problem of "jitter" (the simultaneous appearance of a large number of small messages) in the network can be avoided by synchronizing the node clocks.
gmetad can be deployed on any node within the cluster or on an independent host connected to the cluster via the network. It communicates with gmond via unicast, collects the status information of nodes in the region, and then stores it in the database in XML format.
05 Munin
Munin is a powerful server monitoring software. Compared with traditional software like Nagios and Cacti, it doesn't require PHP or MySQL support and has no Web operation interface. It takes up fewer server resources. At the same time, it can automatically collect data and generate charts, with simple and quick operation.
One of the major advantages of Munin is that it integrates information collection and analysis. There is no need to install a Web server on each node. Moreover, the additional data at the bottom of the detailed information page can help you obtain important statistical information. Its core functions are collection and analysis.
It can summarize the information of multiple servers and conduct unified analysis on the central server. Installation and update through the apt or yum source are both very simple.
When visiting http://localhost/munin, Munin will display an overview diagram, listing all connected nodes, including the specific functional status of each node's disk, network, NFS, processes, etc.
Clicking on the node name will show two rows of charts. On the left side of each row is the daily statistics, and on the right side is the weekly statistics. Clicking on the chart can also view the detailed data of a certain day or month. More detailed information, including abnormal activity notifications, will be displayed at the bottom of the page.
For more Network Monitoring Tools resources, follow the Facebook account & youtube account: Thinkmo Dumps