

For more information, please scan the WhatsApp QR code below to contact customer service.

Hey! Guys, stop slacking off! It's been a long time since I chatted with you all about those super useful tools. Recalling the last time I shared the essential tools for network engineers with you all, it seems like it was just yesterday, but in fact, quite some time has passed. Today, I'm bringing five must-have network monitoring tools in 2025.
Ⅰ. OpenNMS-The Pioneer of Open-Source Network Management
OpenNMS, short for Network Management System, is open-source software.
1. Automatic Discovery and Intelligent Monitoring:
It can automatically scan the network and accurately discover various nodes, whether they are servers, routers, or switches, none can escape its monitoring.
At the same time, it conducts comprehensive monitoring of network services such as HTTP, DNS, and SSH. Once an abnormality occurs in the service, it can be quickly detected.
2. Intelligent Alerts and Flexible Response:
When a system service stops running, OpenNMS will send notifications in a timely manner according to the rules preset by the administrator. There are various notification methods available, such as email and SMS, allowing operation and maintenance personnel to be informed of network obstacles in a timely manner.
Moreover, it can summarize and organize events, and automatically execute corresponding handling actions, such as attempting to restart the failed service.
3. Strong Expandability:
It supports the SNMP network management protocol, which means its management scope can be easily expanded. You can customize various functions according to actual needs, enabling it to better adapt to complex and changing network environments.
Whether it is a small business network or a large enterprise's distributed network, OpenNMS can handle it with ease.

The only fly in the ointment is that OpenNMS currently lacks a sufficient number of rich Chinese documents. For some domestic users, they may encounter some obstacles during the learning and usage process. Moreover, the localized service support is relatively weak, and there is still a long way to go for the localization work. However, for network engineers with a certain technical foundation and a willingness to delve into it, these are not major issues.
II. SugarNMS-An All-around Expert in Intelligent Network Management
The SugarNMS Zhihe Network Management Platform can be regarded as an all - around player in the field of network management. It has all the basic network management functions and is an excellent choice to improve network management efficiency.
▶ Feature Highlights
1. Comprehensive Monitoring Capability:
It adopts a unified device access model and can comprehensively monitor network devices, hosts/servers, middleware applications, web services, etc. From the topological structure of devices to fault management, performance management, configuration management, and security management, it can handle everything properly.
2. Intelligent Discovery and Topology Management:
During the process of automatically discovering network devices, it can accurately identify the device type and manufacturer model, and can also generate a device panel diagram, clearly presenting resource information such as device boards, ports, CPU, and memory.
At the same time, it displays network devices and their connection relationships in the form of an intuitive topology diagram. Users can edit according to the actual situation, facilitating the management of devices, device resources, and connections.
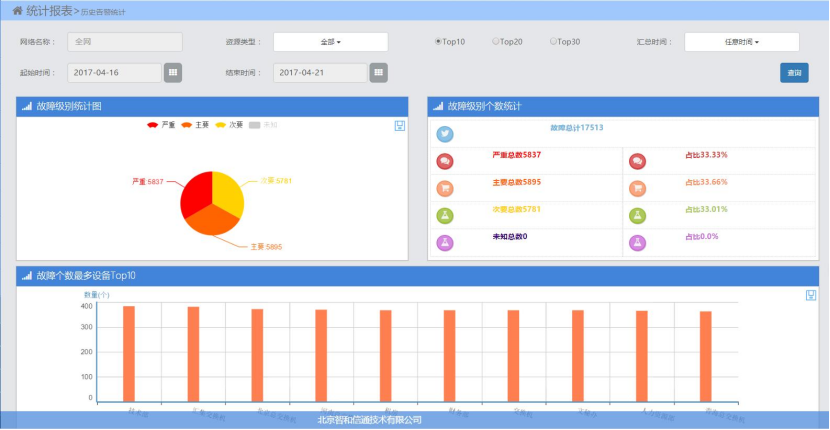
3. Efficient Fault Management:
It has a powerful fault information collection ability and can display various fault information in a timely manner. You can view fault information from multiple dimensions such as devices, resources, and connections, and can also conduct centralized management in a unified fault management interface.
In addition, it also supports a variety of security management functions, such as QOS security policies, MAC - IP binding, black and white lists, and access control, safeguarding network security.
Relatively speaking, in some extremely large and complex network environments, the performance of SugarNMS may still have room for further improvement. However, for the network scale of most enterprises, its performance can fully meet the daily management needs.
III. Nagios-The Mainstay of Open - source Monitoring
As an open-source server/network monitoring solution, Nagios occupies an important position in the field of network monitoring and is a trusted and powerful tool for many network engineers.
▶ Feature Highlights
1. Extensive Monitoring Scope:
It provides a comprehensive monitoring and alarm mechanism for servers, switches, applications, and services. Whether it is network services such as SMTP, POP3, HTTP, NNTP, PING, etc., or host resources such as processes and disks, it can conduct accurate monitoring.
2. Flexible Plugin Expansion:
It has a plugin API, which means that you can easily expand its functions according to actual needs. Through simple plugin design, Nagios can achieve more personalized monitoring requirements and adapt to different network environments and business scenarios.
3. Operation Experience:
It can run on the Linux/Unix platform and also provides a browser-based WEB interface, which is simple and convenient to operate.
System administrators can easily view network status, various system problems, logs, and other information through this interface. Moreover, you can specify a custom event handling controller and even view system monitoring information through a mobile phone to keep abreast of network dynamics anytime, anywhere.
In a large-scale network environment, the configuration and management of Nagios may become relatively complex, requiring network engineers to have certain technical experience and patience. However, once familiar with its configuration process, its powerful monitoring capabilities can be fully utilized.
IV. Collectd-The Master of System Performance Collection
Collectd, a daemon process, focuses on collecting system performance data and provides diverse storage methods.
▶ Feature Highlights
1. Comprehensive Data Collection:
During the system's operation, it periodically statistics various relevant system statistical information, including CPU usage, memory usage, disk I/O, etc.
These data are crucial for analyzing the current system performance bottleneck. Whether it is for performance analysis or predicting the future system load, the data collected by Collectd can provide strong support.
2. Rich Plug-in Ecosystem:
The power of Collectd largely stems from its rich plug-ins. Plug-ins are mainly divided into two categories: input and output. Input plug-ins are used for periodic queries, obtaining various system parameters and submitting them to the daemon process.
For example, the CPU plug-in can read various parameters of the current CPU counter, such as user, system, nice, etc., and send these values to the daemon process. Output plug-ins are responsible for storing or displaying the collected data in an appropriate way.
It is worth mentioning that some plug-ins have special functions. For example, the network plug-in can not only send output data but also receive input values, and it will start a socket port during initialization, working asynchronously and efficiently transmitting data.
3. Flexible Log Management:
Collectd is also equipped with log plug-ins, such as the logfile plug-in and the syslog plug-in. Through these plug-ins, you can set different log levels, which is convenient for recording and managing various information during the system operation, providing detailed log basis for troubleshooting and system optimization.
Collectd itself has relatively powerful and complex functions. For beginners, it may take some time to understand and configure each plug-in to achieve the desired data collection and processing effects. But once mastered, it will become a powerful assistant for you to monitor system performance.
V. Monit - The Intimate Butler for Processes and Devices
Monit is a feature - rich software for monitoring processes, files, directories, and devices, playing a crucial role on Unix platforms.
▶ Feature Highlights
1. Process Monitoring and Automatic Repair:
It is especially suitable for monitoring daemon processes, such as sendmail, ssh, apache, mysql in /etc/init.d when the system starts. Once these processes stop running, Monit can automatically detect it and attempt to repair, greatly reducing system problems caused by process failures.
2. File and Directory Monitoring:
It can monitor various changes in files and directories, such as timestamps, checksums, and file sizes. This is very useful for ensuring system security and data integrity. For example, if the content of an important file is accidentally modified, its md5 or sha1 checksum will change, and Monit can detect it in a timely manner and issue an alarm.
3. Network Link Monitoring:
Whether it is a local or remote TCP, UDP network link, or even Unix Domain Sockets, Monit can effectively monitor. This is crucial for ensuring the normal operation of network services, and can promptly detect problems such as network connection interruptions or abnormalities.
4. System Resource Monitoring:
It can also monitor general system resources, such as CPU usage, memory occupancy, and the load average. By comprehensively monitoring these system resources, you can understand the real - time operating status of the system and detect potential performance problems in advance.
Monit is mainly applicable to Unix platforms. For users of other operating system platforms, it may not be able to exert its advantages. However, in a Unix system environment, its functional advantages are very obvious.
The above are the 5 network monitoring tools carefully selected for you in 2025. Each tool has its unique advantages and application scenarios. I hope it can help network engineers work more efficiently and easily handle various network monitoring problems.
For more 5 monitoring tools resources, follow the Facebook account & youtube account: Thinkmo Dumps